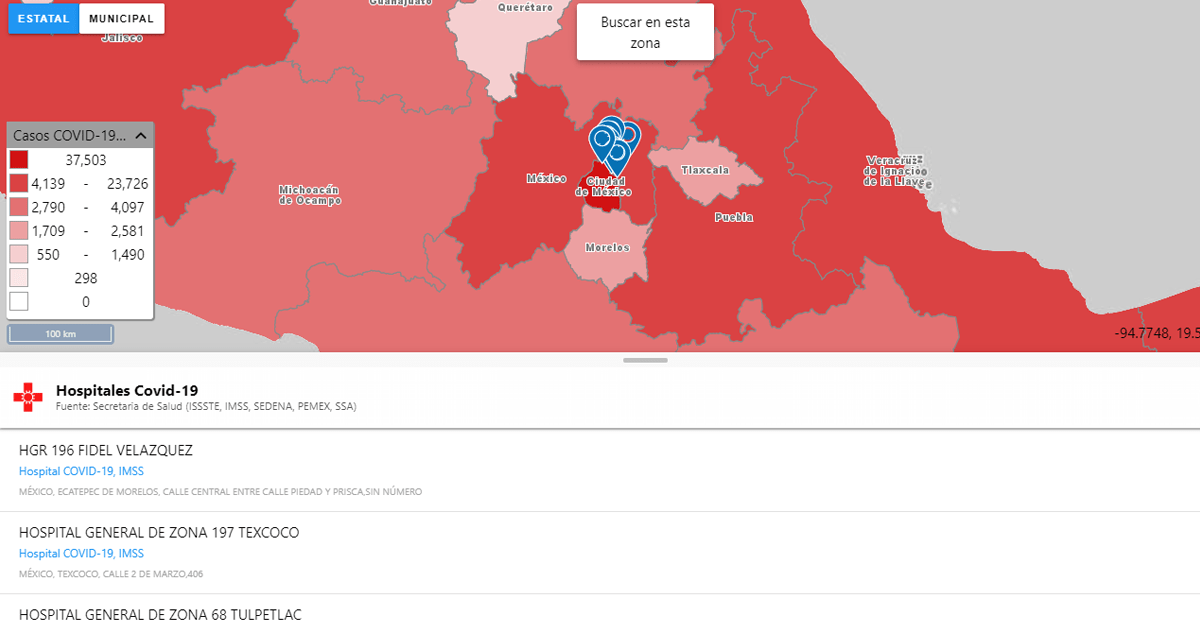
In this map, INEGI (NAtional Infstitute of Statistic and Geography), shows COVID-19 data by state and municipality, as well as useful information such as location of COVID hospitals and pharmacies.
In the navigation the user is allowed to select the municipal or the state map, where it indicates by shades of red the number of contagions in each state or municipality. In addition, the navigation bar have the options for indicating the location of each of the following options on the map:
- COVID-19 Hospitals
- Hospitals
- Pharmacies
- Supermarkets and mini-hop
- Banks
- Gas stations
- Courier and parcel services
- Restaurants
When selecting a municipality or state, the platform will release a bar with a series of information grouped into nine categories: Summary, population, ethnicity, educational and economic characteristics, health services, housing, risk diseases and establishments.
In the "Summary" data category, indicators of confirmed, suspected and negative COVID-19 cases, as well as deaths recorded so far are found.
In addition, it provides data such as population density in states and municipalities, the population of 60 years or older -which is part of vulnerable groups- and the total population, among other demographics.
An important part of this platform is the indicator of health services, as it takes into account statistics about the affiliation or non-affiliation of the population to the different public, federal or state health systems or affiliates of private insurances.

In addition to the statistic on the density of hospital offices per 10 thousand inhabitants and the same data, but on the density of beds, and thus make known in a simple and clear way the services that each municipality and state has.
All available information is freely accessible and has the option to download data to devices
You can access through the following link: https://gaia.inegi.org.mx/covid19/


