Esta herramienta de transparencia está disponible al público con datos abiertos sobre la gestión de medicamentos e insumos médicos en el país.
El Ministerio de Salud Pública y Bienestar Social de Paraguay creó el Centro Nacional de Monitoreo de Medicamentos e Insumos, una herramienta que busca la transparencia de los datos del gobierno. El Ministro de Salud, el Dr. Julio Mazzoleni anunció la nueva plataforma como parte de la sección de transparencia que está al servicio de la población paraguaya.
A través de la plataforma es posible conocer y verificar la distribución de medicamentos e insumos en todo el país y puede ser consultada desde una computadora o celular.
La plataforma es totalmente abierta y no requiere ningún tipo de acceso como creación de una cuenta o usuario y cuenta con un menú fácil de utilizar.
La primera opción que muestra el menú de la interfaz de esta plataforma es Distribución Nacional, en la cual se muestran los datos de la distribución total de medicamentos e insumos en Paraguay con datos del 2018 al 2020. Mostrando el valor total de dicha distribución y el valor por destino (hospitales, institutos, clínicas, etc.).
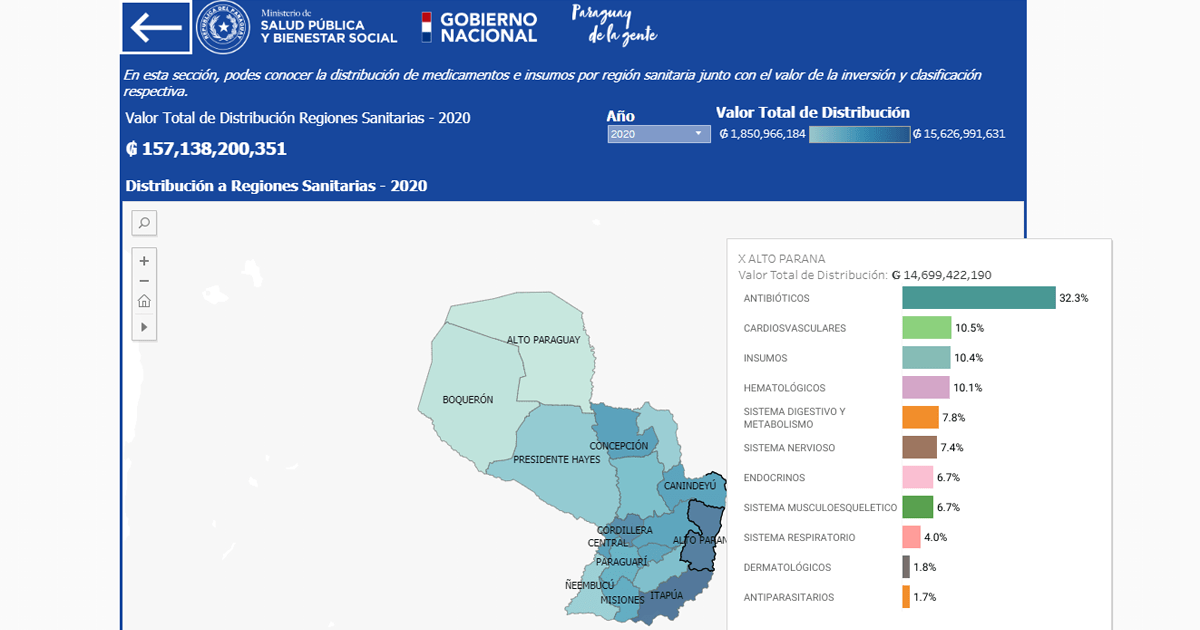
La siguiente pestaña ofrece información de acerca de los Specialized Hospitals, por ejemplo, los pertenecientes al Programa Nacional de Diabetes, o a la Dirección General de Salud Ambiental, entre otros. En esta sección se indican todos los insumos utilizados los últimos tres años en cada servicio de salud especializado.
La tercera sección contiene información sobre la distribución de medicamentos e insumos en cada una de las 18 Health Regions que conforman el país, con datos sobre el valor de la inversión en cada una de estas, que de igual forma muestra datos del 2018 al 2020. De esta manera se puede conocer de forma general en qué invirtió más cada región y cómo se distribuyeron estos insumos.
La última sección corresponde a Productos de Mayor Inversión, en la que muestra una gráfica con los 100 productos de mayor distribución en 2019, así como el monto que representa. Además, aparece una barra para realizar búsquedas sobre productos en específico.
Esta herramienta favorece las prácticas de transparencia en salud, y permite al personal de instituciones de salud pública y a la ciudadanía en general conocer cómo se distribuyen los insumos en todo el país y en hospitales y centros de salud de forma específica.
MINISTERIO DE SALUD PÚBLICA Y BIENESTAR SOCIAL
https://www.mspbs.gov.py/monitoreo-insumos-medicamentos.html


