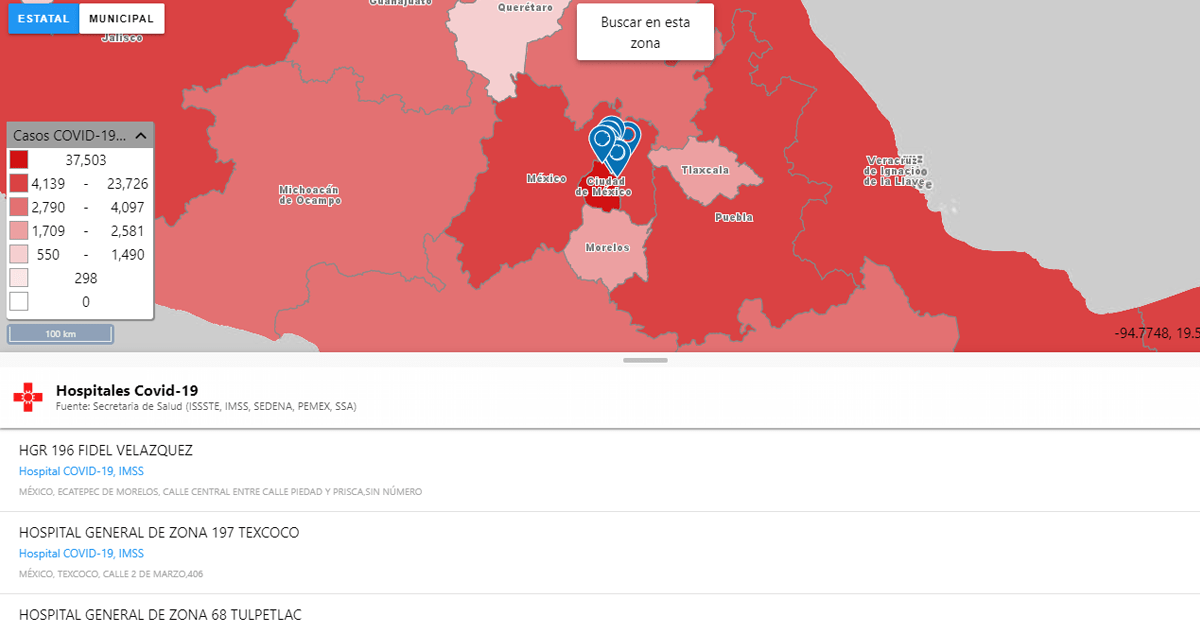
En este mapa el INEGI (Instituto Nacional de Estadística y Geografía), muestra las cifras de COVID-19 por estado y por municipios, además de información útil como ubicación de hospitales COVID y farmacias.
En la navegación se permite al usuario seleccionar el mapa municipal o el estatal, donde indica mediante tonalidades de rojo el número de contagios en cada entidad o municipio. Además, la barra de navegación en el mapa indica opciones para indicar la ubicación de cada una de las siguientes opciones en el mapa:
- COVID-19 Hospitals
- Hospitals
- Pharmacies
- Supermercados y minisúper
- Banks
- Gas stations
- Servicios de mensajería y paquetería
- Restaurants
Al seleccionar un municipio o estado, la plataforma desprenderá una barra con una serie de datos agrupados en nueve categorías: Resumen, población, etnicidad, características educativas y económicas, servicios de salud, viviendas, enfermedades de riesgo y establecimientos.
En la categoría de datos “Resumen”, es donde se encuentran indicadores sobre casos de COVID-19 confirmados, sospechosos y negativos, así como las defunciones registradas hasta el momento.
Además, ofrece datos como la densidad de población en los estados y municipios, la población de 60 años o más -que forma parte de los grupos vulnerables- y la población total, entre otros datos demográficos.
Una parte importante de esta plataforma es el indicador de los servicios de salud, ya que toma en cuenta las estadísticas sobre la afiliación o no afiliación de la población a los diferentes sistemas de salud públicos, federales o estatales o afiliados a seguros privados.
Además de la estadística sobre la densidad de consultorios de hospitales por cada 10 mil habitantes y el mismo dato, pero sobre la densidad de camas, y de esta forma dar a conocer de una forma sencilla y clara los servicios con los que cuenta cada municipio y estado.
Toda la información disponible es de libre acceso y cuenta con opción de descargar los datos a dispositivos y ordenadores.
Puedes ingresar a través de este enlace: https://gaia.inegi.org.mx/covid19/